|
|
|
|
 |
| |
|
You Are Here: Vermont Department of Labor ELMIRegionsLabor Market Areas ELMIRegionsLabor Market Areas |
| |
 |
Morristown-Waterbury Labor Market Area |
 |
| |
| Labor Market Areas |
|
|
| |
|
|
| |
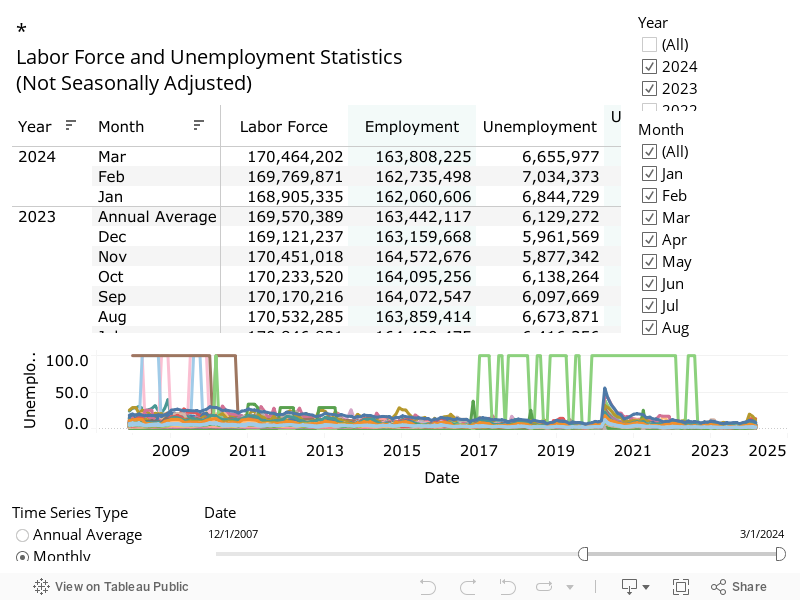
| Labor Force - with employment and unemployment |
| |
| Morristown-Waterbury LMA |
|
|
| |
| View more Labor Force and Unemployment data. |
| Source: Vermont Department of Labor, Local Area Unemployment Statistics |
| |
| Industry - establishments, jobs, and wages |
| |
| Morristown-Waterbury LMA |
| U.I. Covered Employment & Wages, 2023 annual averages |
| |
| NAICS Industry Sector |
Owner-
ship |
Establish-
ments |
Jobs |
% of
total
jobs |
Total
Wages |
Average
Wage |
| Total Covered - all ownerships |
All |
1,985 |
16,886 |
100.0 |
$1,002,209,837 |
$59,353 |
| Private ownership |
Private |
1,902 |
13,489 |
79.9 |
$784,823,803 |
$58,181 |
| Goods Producing domain
|
Private |
328 |
2,224 |
13.2 |
$132,749,604 |
$59,683 |
| Natural Resources and Mining supersector
|
Private |
32 |
256 |
1.5 |
$13,589,975 |
$53,172 |
| Agriculture, forestry, fishing and hunting
|
Private |
Not published, but included in subtotals |
| Mining
|
Private |
Not published, but included in subtotals |
| Construction supersector
|
Private |
221 |
1,050 |
6.2 |
$65,004,972 |
$61,910 |
| Manufacturing supersector
|
Private |
75 |
919 |
5.4 |
$54,154,657 |
$58,949 |
| Manufacturing
|
Private |
75 |
919 |
5.4 |
$54,154,657 |
$58,949 |
| Durable Goods manufacturing |
Private |
29 |
505 |
3.0 |
$33,403,229 |
$66,091 |
| Non-Durable Goods manufacturing |
Private |
46 |
413 |
2.4 |
$20,751,428 |
$50,215 |
| Service Providing domain
|
Private |
1,575 |
11,265 |
66.7 |
$652,074,199 |
$57,885 |
| Trade, Transportation, and Utilities supersector
|
Private |
320 |
2,715 |
16.1 |
$132,001,777 |
$48,621 |
| Wholesale trade
|
Private |
96 |
250 |
1.5 |
$23,698,781 |
$94,764 |
| Retail trade
|
Private |
195 |
2,142 |
12.7 |
$81,003,530 |
$37,818 |
| Transportation and warehousing
|
Private |
27 |
124 |
0.7 |
$8,304,627 |
$66,884 |
| Utilities
|
Private |
3 |
199 |
1.2 |
$18,994,839 |
$95,572 |
| Information supersector
|
Private |
65 |
224 |
1.3 |
$20,619,100 |
$92,187 |
| Financial Activities supersector
|
Private |
132 |
473 |
2.8 |
$39,241,813 |
$82,935 |
| Finance and insurance
|
Private |
78 |
308 |
1.8 |
$28,735,473 |
$93,373 |
| Real estate and rental and leasing
|
Private |
54 |
165 |
1.0 |
$10,506,340 |
$63,515 |
| Professional and Business Services supersector
|
Private |
587 |
1,605 |
9.5 |
$162,541,298 |
$101,293 |
| Professional and technical services
|
Private |
382 |
914 |
5.4 |
$103,235,511 |
$112,938 |
| Management of companies and enterprises
|
Private |
20 |
228 |
1.4 |
$32,494,105 |
$142,571 |
| Administrative and waste services
|
Private |
185 |
463 |
2.7 |
$26,811,682 |
$57,951 |
| Education and Health Services supersector
|
Private |
159 |
2,392 |
14.2 |
$144,670,907 |
$60,481 |
| Educational services
|
Private |
41 |
255 |
1.5 |
$10,279,907 |
$40,353 |
| Health care and social assistance
|
Private |
119 |
2,137 |
12.7 |
$134,391,000 |
$62,880 |
| Leisure and Hospitality supersector
|
Private |
174 |
3,410 |
20.2 |
$133,401,559 |
$39,117 |
| Arts, entertainment, and recreation
|
Private |
38 |
297 |
1.8 |
$12,915,104 |
$43,534 |
| Accommodation and food services
|
Private |
136 |
3,114 |
18.4 |
$120,486,455 |
$38,696 |
| Accommodation
|
Private |
41 |
1,734 |
10.3 |
$77,981,139 |
$44,974 |
| Food services and drinking places
|
Private |
95 |
1,380 |
8.2 |
$42,505,316 |
$30,806 |
| Other services, except public administration supersector
|
Private |
137 |
446 |
2.6 |
$19,597,745 |
$43,917 |
| Unspecified industry supersector
|
Private |
Not published, but included in subtotals |
| Government total |
All Gvt |
83 |
3,396 |
20.1 |
$217,386,034 |
$64,008 |
| Federal Government * |
Federal Gvt |
20 |
73 |
0.4 |
$4,560,338 |
$62,187 |
| Postal service
|
Federal Gvt |
16 |
67 |
0.4 |
$4,329,429 |
$64,699 |
| Public administration
|
Federal Gvt |
4 |
6 |
0.0 |
$230,909 |
$35,984 |
| State government * |
State Gvt |
18 |
1,643 |
9.7 |
$123,594,809 |
$75,210 |
| Educational services
|
State Gvt |
2 |
207 |
1.2 |
$9,489,748 |
$45,844 |
| Public administration
|
State Gvt |
8 |
781 |
4.6 |
$63,262,739 |
$80,968 |
| Local government * |
Local Gvt |
45 |
1,680 |
9.9 |
$89,230,887 |
$53,127 |
| Educational services
|
Local Gvt |
14 |
1,247 |
7.4 |
$63,461,571 |
$50,902 |
| Public administration
|
Local Gvt |
23 |
377 |
2.2 |
$21,133,951 |
$56,083 |
|
| |
| * Detail may not add to total. Only selected industries listed.
| | View more industry detail for Private and Government |
| Source: Vermont Department of Labor, Quarterly Census of Employment and Wages |
| |
| Jobseeker Characteristics |
| |
| Morristown-Waterbury LMA |
|
July 2023 - June 2024
|
| | Morristown-Waterbury |
| |
Job
Seekers |
% of
total |
| All Job Seekers |
529 |
100.0 |
| Gender |
| Female |
269 |
50.9 |
| Male |
211 |
39.9 |
| Education Status |
| In School - Middle or High school |
21 |
4.0 |
| In School - Post Secondary school |
64 |
12.1 |
| Not In School - High School graduate |
354 |
66.9 |
| Not In School - Not a High School Graduate |
47 |
8.9 |
| Race |
| White |
387 |
73.2 |
| African American |
22 |
4.2 |
| American Indian and Alaskan Native |
3 |
0.6 |
| Asian |
11 |
2.1 |
| Hawaiian Native and Other Pacific Islander |
2 |
0.4 |
|
| |
| Jobseeker Characteristics reflect only clients served by VDOL.
| | View the complete profile |
| Source: Vermont Department of Labor, Labor Exchange Information |
| |
| Educational & Training Resources |
| |
| Morristown-Waterbury LMA |
| Techinical Training Centers, Colleges, Universities and Professional Schools |
| |
|
|
| Statewide Directories
Colleges & Universities
Short-Term Training Opportunities and Certificate Programs
Technical Training Centers
|
| |
| American Job Centers |
| |
| Morristown-Waterbury LMA |
| |
|
|
| |
|
Towns in this labor market |
| |
| Morristown-Waterbury LMA |
| |
Belvidere town
Craftsbury town
Eden town
Elmore town
Greensboro town
|
Hardwick town
Hyde Park town
Johnson town
Lowell town
Morristown town
|
Stowe town
Waterbury town
Waterville town
Wolcott town
|
|
|
|
| |
|
|
|
|
|
|
|
|
|
|
|
|