|
|
|
|
 |
| |
|
You Are Here: Vermont Department of Labor ELMIRegionsLabor Market Areas ELMIRegionsLabor Market Areas |
| |
 |
Manchester Labor Market Area |
 |
| |
| Labor Market Areas |
|
|
| |
|
|
| |
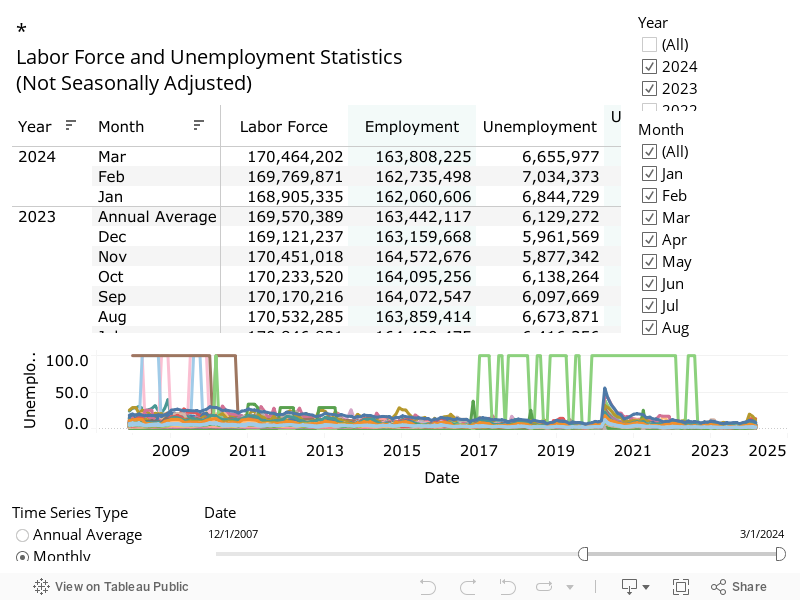
| Labor Force - with employment and unemployment |
| |
| Manchester LMA |
|
|
| |
| View more Labor Force and Unemployment data. |
| Source: Vermont Department of Labor, Local Area Unemployment Statistics |
| |
| Industry - establishments, jobs, and wages |
| |
| Manchester LMA |
| U.I. Covered Employment & Wages, 2022 annual averages |
| |
| NAICS Industry Sector |
Owner-
ship |
Establish-
ments |
Jobs |
% of
total
jobs |
Total
Wages |
Average
Wage |
| Total Covered - all ownerships |
All |
1,406 |
9,432 |
100.0 |
$522,792,656 |
$55,430 |
| Private ownership |
Private |
1,355 |
8,727 |
92.5 |
$487,367,880 |
$55,845 |
| Goods Producing domain
|
Private |
266 |
2,168 |
23.0 |
$117,006,160 |
$53,961 |
| Natural Resources and Mining supersector
|
Private |
36 |
212 |
2.2 |
$10,260,835 |
$48,381 |
| Agriculture, forestry, fishing and hunting
|
Private |
29 |
87 |
0.9 |
$2,665,078 |
$30,516 |
| Mining
|
Private |
7 |
125 |
1.3 |
$7,595,757 |
$60,888 |
| Construction supersector
|
Private |
183 |
674 |
7.1 |
$35,167,152 |
$52,177 |
| Manufacturing supersector
|
Private |
47 |
1,282 |
13.6 |
$71,578,173 |
$55,822 |
| Manufacturing
|
Private |
47 |
1,282 |
13.6 |
$71,578,173 |
$55,822 |
| Durable Goods manufacturing |
Private |
Not published, but included in subtotals |
| Non-Durable Goods manufacturing |
Private |
Not published, but included in subtotals |
| Service Providing domain
|
Private |
1,089 |
6,559 |
69.5 |
$370,361,720 |
$56,468 |
| Trade, Transportation, and Utilities supersector
|
Private |
229 |
1,641 |
17.4 |
$83,967,260 |
$51,155 |
| Wholesale trade
|
Private |
60 |
159 |
1.7 |
$18,173,642 |
$114,660 |
| Retail trade
|
Private |
144 |
1,352 |
14.3 |
$56,792,454 |
$42,004 |
| Transportation and warehousing
|
Private |
Not published, but included in subtotals |
| Utilities
|
Private |
Not published, but included in subtotals |
| Information supersector
|
Private |
45 |
109 |
1.2 |
$11,223,151 |
$103,122 |
| Financial Activities supersector
|
Private |
113 |
312 |
3.3 |
$29,396,918 |
$94,347 |
| Finance and insurance
|
Private |
68 |
159 |
1.7 |
$20,324,601 |
$127,561 |
| Real estate and rental and leasing
|
Private |
45 |
152 |
1.6 |
$9,072,317 |
$59,589 |
| Professional and Business Services supersector
|
Private |
396 |
962 |
10.2 |
$103,453,898 |
$107,568 |
| Professional and technical services
|
Private |
248 |
400 |
4.2 |
$58,506,528 |
$146,204 |
| Management of companies and enterprises
|
Private |
Not published, but included in subtotals |
| Administrative and waste services
|
Private |
Not published, but included in subtotals |
| Education and Health Services supersector
|
Private |
97 |
1,047 |
11.1 |
$53,928,981 |
$51,525 |
| Educational services
|
Private |
31 |
425 |
4.5 |
$24,655,259 |
$58,035 |
| Health care and social assistance
|
Private |
66 |
622 |
6.6 |
$29,273,722 |
$47,077 |
| Leisure and Hospitality supersector
|
Private |
135 |
2,321 |
24.6 |
$81,665,178 |
$35,192 |
| Arts, entertainment, and recreation
|
Private |
34 |
488 |
5.2 |
$17,454,780 |
$35,792 |
| Accommodation and food services
|
Private |
101 |
1,833 |
19.4 |
$64,210,398 |
$35,032 |
| Accommodation
|
Private |
32 |
1,105 |
11.7 |
$41,795,454 |
$37,824 |
| Food services and drinking places
|
Private |
69 |
728 |
7.7 |
$22,414,944 |
$30,793 |
| Other services, except public administration supersector
|
Private |
75 |
168 |
1.8 |
$6,726,334 |
$40,057 |
| Government total |
All Gvt |
51 |
705 |
7.5 |
$35,424,776 |
$50,284 |
| Federal Government * |
Federal Gvt |
20 |
75 |
0.8 |
$4,725,412 |
$62,936 |
| Postal service
|
Federal Gvt |
17 |
53 |
0.6 |
$3,294,207 |
$62,548 |
| Public administration
|
Federal Gvt |
3 |
22 |
0.2 |
$1,431,205 |
$63,847 |
| State government * |
State Gvt |
2 |
18 |
0.2 |
$884,181 |
$49,581 |
| Local government * |
Local Gvt |
29 |
612 |
6.5 |
$29,815,183 |
$48,751 |
| Educational services
|
Local Gvt |
4 |
404 |
4.3 |
$20,732,404 |
$51,360 |
| Public administration
|
Local Gvt |
22 |
189 |
2.0 |
$8,258,618 |
$43,735 |
|
| |
| * Detail may not add to total. Only selected industries listed.
| | View more industry detail for Private and Government |
| Source: Vermont Department of Labor, Quarterly Census of Employment and Wages |
| |
| Jobseeker Characteristics |
| |
| Manchester LMA |
|
April 2023 - March 2024
|
| | Manchester |
| |
Job
Seekers |
% of
total |
| All Job Seekers |
246 |
100.0 |
| Gender |
| Female |
109 |
44.3 |
| Male |
107 |
43.5 |
| Education Status |
| In School - Middle or High school |
8 |
3.3 |
| In School - Post Secondary school |
29 |
11.8 |
| Not In School - High School graduate |
173 |
70.3 |
| Not In School - Not a High School Graduate |
17 |
6.9 |
| Race |
| White |
195 |
79.3 |
| African American |
5 |
2.0 |
| American Indian and Alaskan Native |
- | - |
| Asian |
1 |
0.4 |
| Hawaiian Native and Other Pacific Islander |
- | - |
|
| |
| Jobseeker Characteristics reflect only clients served by VDOL.
| | View the complete profile |
| Source: Vermont Department of Labor, Labor Exchange Information |
| |
| Educational & Training Resources |
| |
| Manchester LMA |
| Techinical Training Centers, Colleges, Universities and Professional Schools |
| |
|
|
| Statewide Directories
Colleges & Universities
Short-Term Training Opportunities and Certificate Programs
Technical Training Centers
|
| |
| American Job Centers |
| |
| Manchester LMA |
| |
|
No Career Resource Centers are located in this area.
Pick an adjacent area or visit Find Your Career Resource Center.
|
| |
|
Towns in this labor market |
| |
| Manchester LMA |
| |
Arlington town
Danby town
Dorset town
Landgrove town
Londonderry town
|
Manchester town
Mount Tabor town
Pawlet town
Peru town
Poultney town
|
Rupert town
Sandgate town
Stratton town
Sunderland town
Tinmouth town
|
Wells town
Weston town
Winhall town
|
|
|
| |
|
|
|
|
|
|
|
|
|
|
|
|