|
|
|
|
 |
| |
|
You Are Here: Vermont Department of Labor ELMIRegionsLabor Market Areas ELMIRegionsLabor Market Areas |
| |
 |
Rutland Labor Market Area |
 |
| |
| Labor Market Areas |
|
|
| |
|
|
| |
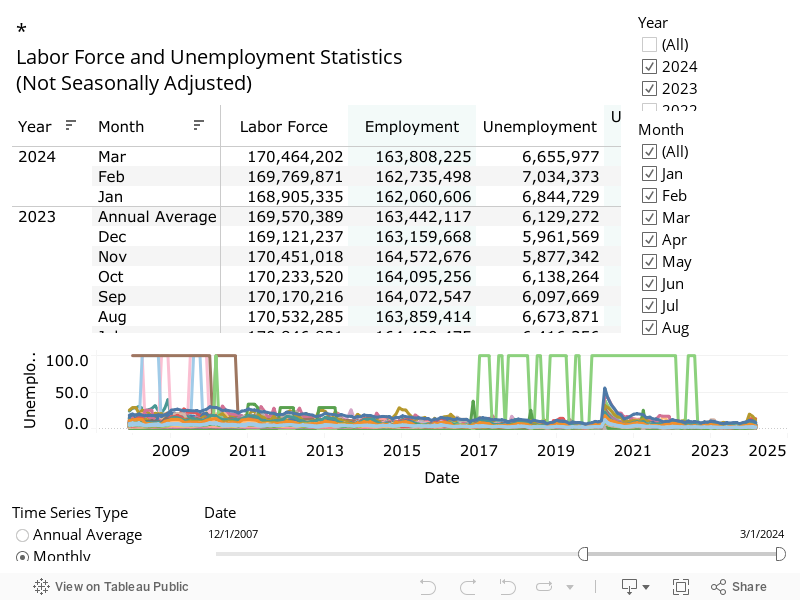
| Labor Force - with employment and unemployment |
| |
| Rutland LMA |
|
|
| |
| View more Labor Force and Unemployment data. |
| Source: Vermont Department of Labor, Local Area Unemployment Statistics |
| |
| Industry - establishments, jobs, and wages |
| |
| Rutland LMA |
| U.I. Covered Employment & Wages, 2022 annual averages |
| |
| NAICS Industry Sector |
Owner-
ship |
Establish-
ments |
Jobs |
% of
total
jobs |
Total
Wages |
Average
Wage |
| Total Covered - all ownerships |
All |
1,716 |
19,455 |
100.0 |
$1,112,628,615 |
$57,190 |
| Private ownership |
Private |
1,627 |
16,564 |
85.1 |
$953,297,743 |
$57,552 |
| Goods Producing domain
|
Private |
269 |
3,570 |
18.4 |
$222,172,511 |
$62,229 |
| Natural Resources and Mining supersector
|
Private |
21 |
227 |
1.2 |
$15,378,645 |
$67,648 |
| Agriculture, forestry, fishing and hunting
|
Private |
16 |
41 |
0.2 |
$1,511,970 |
$36,876 |
| Mining
|
Private |
5 |
186 |
1.0 |
$13,866,675 |
$74,419 |
| Construction supersector
|
Private |
190 |
1,018 |
5.2 |
$56,233,487 |
$55,262 |
| Manufacturing supersector
|
Private |
59 |
2,325 |
12.0 |
$150,560,379 |
$64,748 |
| Manufacturing
|
Private |
59 |
2,325 |
12.0 |
$150,560,379 |
$64,748 |
| Durable Goods manufacturing |
Private |
32 |
1,975 |
10.2 |
$135,495,928 |
$68,620 |
| Non-Durable Goods manufacturing |
Private |
26 |
351 |
1.8 |
$15,064,451 |
$42,949 |
| Service Providing domain
|
Private |
1,359 |
12,994 |
66.8 |
$731,125,232 |
$56,267 |
| Trade, Transportation, and Utilities supersector
|
Private |
353 |
4,115 |
21.2 |
$204,532,287 |
$49,709 |
| Wholesale trade
|
Private |
95 |
643 |
3.3 |
$40,726,118 |
$63,338 |
| Retail trade
|
Private |
224 |
2,608 |
13.4 |
$103,100,636 |
$39,527 |
| Transportation and warehousing
|
Private |
30 |
537 |
2.8 |
$21,391,465 |
$39,841 |
| Utilities
|
Private |
4 |
326 |
1.7 |
$39,314,068 |
$120,472 |
| Information supersector
|
Private |
33 |
200 |
1.0 |
$12,175,752 |
$60,778 |
| Financial Activities supersector
|
Private |
111 |
533 |
2.7 |
$35,894,183 |
$67,312 |
| Finance and insurance
|
Private |
67 |
361 |
1.9 |
$28,091,237 |
$77,815 |
| Real estate and rental and leasing
|
Private |
45 |
172 |
0.9 |
$7,802,946 |
$45,300 |
| Professional and Business Services supersector
|
Private |
401 |
1,779 |
9.1 |
$143,494,268 |
$80,656 |
| Professional and technical services
|
Private |
229 |
533 |
2.7 |
$41,776,428 |
$78,318 |
| Management of companies and enterprises
|
Private |
21 |
392 |
2.0 |
$56,593,634 |
$144,249 |
| Administrative and waste services
|
Private |
151 |
853 |
4.4 |
$45,124,206 |
$52,880 |
| Education and Health Services supersector
|
Private |
186 |
4,107 |
21.1 |
$273,631,012 |
$66,630 |
| Educational services
|
Private |
18 |
95 |
0.5 |
$2,570,124 |
$27,078 |
| Health care and social assistance
|
Private |
168 |
4,012 |
20.6 |
$271,060,888 |
$67,565 |
| Leisure and Hospitality supersector
|
Private |
147 |
1,697 |
8.7 |
$41,003,139 |
$24,156 |
| Arts, entertainment, and recreation
|
Private |
25 |
192 |
1.0 |
$3,862,622 |
$20,118 |
| Accommodation and food services
|
Private |
122 |
1,505 |
7.7 |
$37,140,517 |
$24,671 |
| Accommodation
|
Private |
21 |
329 |
1.7 |
$8,953,543 |
$27,221 |
| Food services and drinking places
|
Private |
101 |
1,176 |
6.0 |
$28,186,974 |
$23,958 |
| Other services, except public administration supersector
|
Private |
128 |
562 |
2.9 |
$20,394,591 |
$36,262 |
| Government total |
All Gvt |
88 |
2,891 |
14.9 |
$159,330,872 |
$55,116 |
| Federal Government * |
Federal Gvt |
26 |
213 |
1.1 |
$14,301,343 |
$67,247 |
| Postal service
|
Federal Gvt |
14 |
93 |
0.5 |
$5,448,797 |
$58,327 |
| Public administration
|
Federal Gvt |
12 |
119 |
0.6 |
$8,852,546 |
$74,235 |
| State government * |
State Gvt |
25 |
870 |
4.5 |
$51,933,291 |
$59,722 |
| Educational services
|
State Gvt |
4 |
383 |
2.0 |
$18,931,467 |
$49,397 |
| Public administration
|
State Gvt |
12 |
328 |
1.7 |
$22,903,145 |
$69,721 |
| Local government * |
Local Gvt |
38 |
1,809 |
9.3 |
$93,096,238 |
$51,475 |
| Educational services
|
Local Gvt |
9 |
1,275 |
6.6 |
$68,709,043 |
$53,904 |
| Public administration
|
Local Gvt |
22 |
372 |
1.9 |
$16,192,329 |
$43,586 |
|
| |
| * Detail may not add to total. Only selected industries listed.
| | View more industry detail for Private and Government |
| Source: Vermont Department of Labor, Quarterly Census of Employment and Wages |
| |
| Jobseeker Characteristics |
| |
| Rutland LMA |
|
April 2023 - March 2024
|
| | Rutland |
| |
Job
Seekers |
% of
total |
| All Job Seekers |
847 |
100.0 |
| Gender |
| Female |
398 |
47.0 |
| Male |
390 |
46.0 |
| Education Status |
| In School - Middle or High school |
53 |
6.3 |
| In School - Post Secondary school |
82 |
9.7 |
| Not In School - High School graduate |
577 |
68.1 |
| Not In School - Not a High School Graduate |
89 |
10.5 |
| Race |
| White |
680 |
80.3 |
| African American |
35 |
4.1 |
| American Indian and Alaskan Native |
3 |
0.4 |
| Asian |
9 |
1.1 |
| Hawaiian Native and Other Pacific Islander |
2 |
0.2 |
|
| |
| Jobseeker Characteristics reflect only clients served by VDOL.
| | View the complete profile |
| Source: Vermont Department of Labor, Labor Exchange Information |
| |
| Educational & Training Resources |
| |
| Rutland LMA |
| Techinical Training Centers, Colleges, Universities and Professional Schools |
| |
|
|
| Statewide Directories
Colleges & Universities
Short-Term Training Opportunities and Certificate Programs
Technical Training Centers
|
| |
| American Job Centers |
| |
| Rutland LMA |
| |
|
|
| |
|
Towns in this labor market |
| |
| Rutland LMA |
| |
Castleton town
Chittenden town
Clarendon town
Hubbardton town
Ira town
|
Mendon town
Middletown Springs town
Pittsford town
Proctor town
Rutland city
|
Rutland town
Shrewsbury town
Wallingford town
West Rutland town
|
|
|
|
| |
|
|
|
|
|
|
|
|
|
|
|
|