|
|
|
|
 |
| |
|
You Are Here: Vermont Department of Labor ELMIRegionsLabor Market Areas ELMIRegionsLabor Market Areas |
| |
 |
Bennington Labor Market Area |
 |
| |
| Labor Market Areas |
|
|
| |
|
|
| |
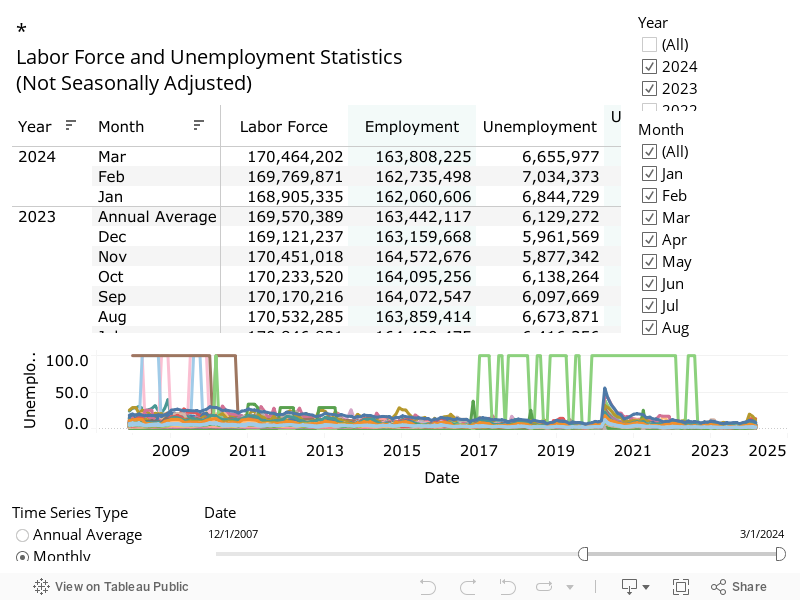
| Labor Force - with employment and unemployment |
| |
| Bennington LMA |
|
|
| |
| View more Labor Force and Unemployment data. |
| Source: Vermont Department of Labor, Local Area Unemployment Statistics |
| |
| Industry - establishments, jobs, and wages |
| |
| Bennington LMA |
| U.I. Covered Employment & Wages, 2022 annual averages |
| |
| NAICS Industry Sector |
Owner-
ship |
Establish-
ments |
Jobs |
% of
total
jobs |
Total
Wages |
Average
Wage |
| Total Covered - all ownerships |
All |
819 |
9,640 |
100.0 |
$501,029,341 |
$51,972 |
| Private ownership |
Private |
782 |
8,003 |
83.0 |
$416,543,315 |
$52,047 |
| Goods Producing domain
|
Private |
112 |
1,332 |
13.8 |
$72,437,726 |
$54,373 |
| Natural Resources and Mining supersector
|
Private |
7 |
44 |
0.5 |
$1,611,391 |
$36,832 |
| Agriculture, forestry, fishing and hunting
|
Private |
Not published, but included in subtotals |
| Mining
|
Private |
Not published, but included in subtotals |
| Construction supersector
|
Private |
63 |
221 |
2.3 |
$11,170,306 |
$50,602 |
| Manufacturing supersector
|
Private |
43 |
1,068 |
11.1 |
$59,656,029 |
$55,871 |
| Manufacturing
|
Private |
43 |
1,068 |
11.1 |
$59,656,029 |
$55,871 |
| Durable Goods manufacturing |
Private |
25 |
795 |
8.2 |
$46,505,762 |
$58,473 |
| Non-Durable Goods manufacturing |
Private |
18 |
272 |
2.8 |
$13,150,267 |
$48,273 |
| Service Providing domain
|
Private |
670 |
6,671 |
69.2 |
$344,105,589 |
$51,583 |
| Trade, Transportation, and Utilities supersector
|
Private |
150 |
1,549 |
16.1 |
$66,202,915 |
$42,732 |
| Wholesale trade
|
Private |
42 |
101 |
1.0 |
$7,933,929 |
$78,426 |
| Retail trade
|
Private |
97 |
1,357 |
14.1 |
$54,639,758 |
$40,255 |
| Transportation and warehousing
|
Private |
11 |
91 |
0.9 |
$3,629,228 |
$39,991 |
| Information supersector
|
Private |
32 |
148 |
1.5 |
$8,502,816 |
$57,516 |
| Financial Activities supersector
|
Private |
50 |
224 |
2.3 |
$19,548,935 |
$87,207 |
| Finance and insurance
|
Private |
34 |
154 |
1.6 |
$15,806,666 |
$102,584 |
| Real estate and rental and leasing
|
Private |
16 |
70 |
0.7 |
$3,742,269 |
$53,398 |
| Professional and Business Services supersector
|
Private |
201 |
596 |
6.2 |
$40,960,329 |
$68,735 |
| Professional and technical services
|
Private |
Not published, but included in subtotals |
| Management of companies and enterprises
|
Private |
Not published, but included in subtotals |
| Administrative and waste services
|
Private |
79 |
335 |
3.5 |
$20,641,537 |
$61,632 |
| Education and Health Services supersector
|
Private |
111 |
3,129 |
32.5 |
$184,723,714 |
$59,027 |
| Educational services
|
Private |
17 |
627 |
6.5 |
$27,798,611 |
$44,342 |
| Health care and social assistance
|
Private |
94 |
2,503 |
26.0 |
$156,925,103 |
$62,705 |
| Leisure and Hospitality supersector
|
Private |
68 |
744 |
7.7 |
$16,699,374 |
$22,453 |
| Arts, entertainment, and recreation
|
Private |
12 |
88 |
0.9 |
$2,005,324 |
$22,896 |
| Accommodation and food services
|
Private |
56 |
656 |
6.8 |
$14,694,050 |
$22,394 |
| Accommodation
|
Private |
13 |
92 |
1.0 |
$2,339,926 |
$25,550 |
| Food services and drinking places
|
Private |
43 |
565 |
5.9 |
$12,354,124 |
$21,882 |
| Other services, except public administration supersector
|
Private |
59 |
281 |
2.9 |
$7,467,506 |
$26,622 |
| Government total |
All Gvt |
37 |
1,637 |
17.0 |
$84,486,026 |
$51,602 |
| Federal Government * |
Federal Gvt |
9 |
137 |
1.4 |
$12,308,668 |
$89,572 |
| Postal service
|
Federal Gvt |
6 |
39 |
0.4 |
$2,544,852 |
$65,392 |
| Public administration
|
Federal Gvt |
3 |
99 |
1.0 |
$9,763,816 |
$99,125 |
| State government * |
State Gvt |
10 |
397 |
4.1 |
$23,884,900 |
$60,113 |
| Educational services
|
State Gvt |
2 |
31 |
0.3 |
$1,048,961 |
$34,021 |
| Public administration
|
State Gvt |
5 |
118 |
1.2 |
$8,254,462 |
$70,052 |
| Local government * |
Local Gvt |
18 |
1,103 |
11.4 |
$48,292,458 |
$43,803 |
| Educational services
|
Local Gvt |
5 |
924 |
9.6 |
$39,339,341 |
$42,598 |
| Public administration
|
Local Gvt |
9 |
137 |
1.4 |
$6,440,897 |
$46,928 |
|
| |
| * Detail may not add to total. Only selected industries listed.
| | View more industry detail for Private and Government |
| Source: Vermont Department of Labor, Quarterly Census of Employment and Wages |
| |
| Jobseeker Characteristics |
| |
| Bennington LMA |
|
April 2023 - March 2024
|
| | Bennington |
| |
Job
Seekers |
% of
total |
| All Job Seekers |
695 |
100.0 |
| Gender |
| Female |
309 |
44.5 |
| Male |
310 |
44.6 |
| Education Status |
| In School - Middle or High school |
52 |
7.5 |
| In School - Post Secondary school |
68 |
9.8 |
| Not In School - High School graduate |
424 |
61.0 |
| Not In School - Not a High School Graduate |
88 |
12.7 |
| Race |
| White |
487 |
70.1 |
| African American |
42 |
6.0 |
| American Indian and Alaskan Native |
2 |
0.3 |
| Asian |
39 |
5.6 |
| Hawaiian Native and Other Pacific Islander |
- | - |
|
| |
| Jobseeker Characteristics reflect only clients served by VDOL.
| | View the complete profile |
| Source: Vermont Department of Labor, Labor Exchange Information |
| |
| Educational & Training Resources |
| |
| Bennington LMA |
| Techinical Training Centers, Colleges, Universities and Professional Schools |
| |
|
|
| Statewide Directories
Colleges & Universities
Short-Term Training Opportunities and Certificate Programs
Technical Training Centers
|
| |
| American Job Centers |
| |
| Bennington LMA |
| |
|
|
| |
|
Towns in this labor market |
| |
| Bennington LMA |
| |
Bennington town
Glastenbury town
Pownal town
Shaftsbury town
Woodford town
|
|
|
|
|
|
| |
|
|
|
|
|
|
|
|
|
|
|
|